
An early assessment of Google Places SDK from an App developer perspective.

|
I'm software Dev.For now enjoying with Swift and working on video processing, geo mapping and other tech voodoo stuff
|
An early assessment of Google Places SDK from an App developer perspective.

Prior to iOS 14, If you are deep down in a navigation stack, the only way to go back is to smash your back button until you reach the root level. This is no longer a case in iOS 14.
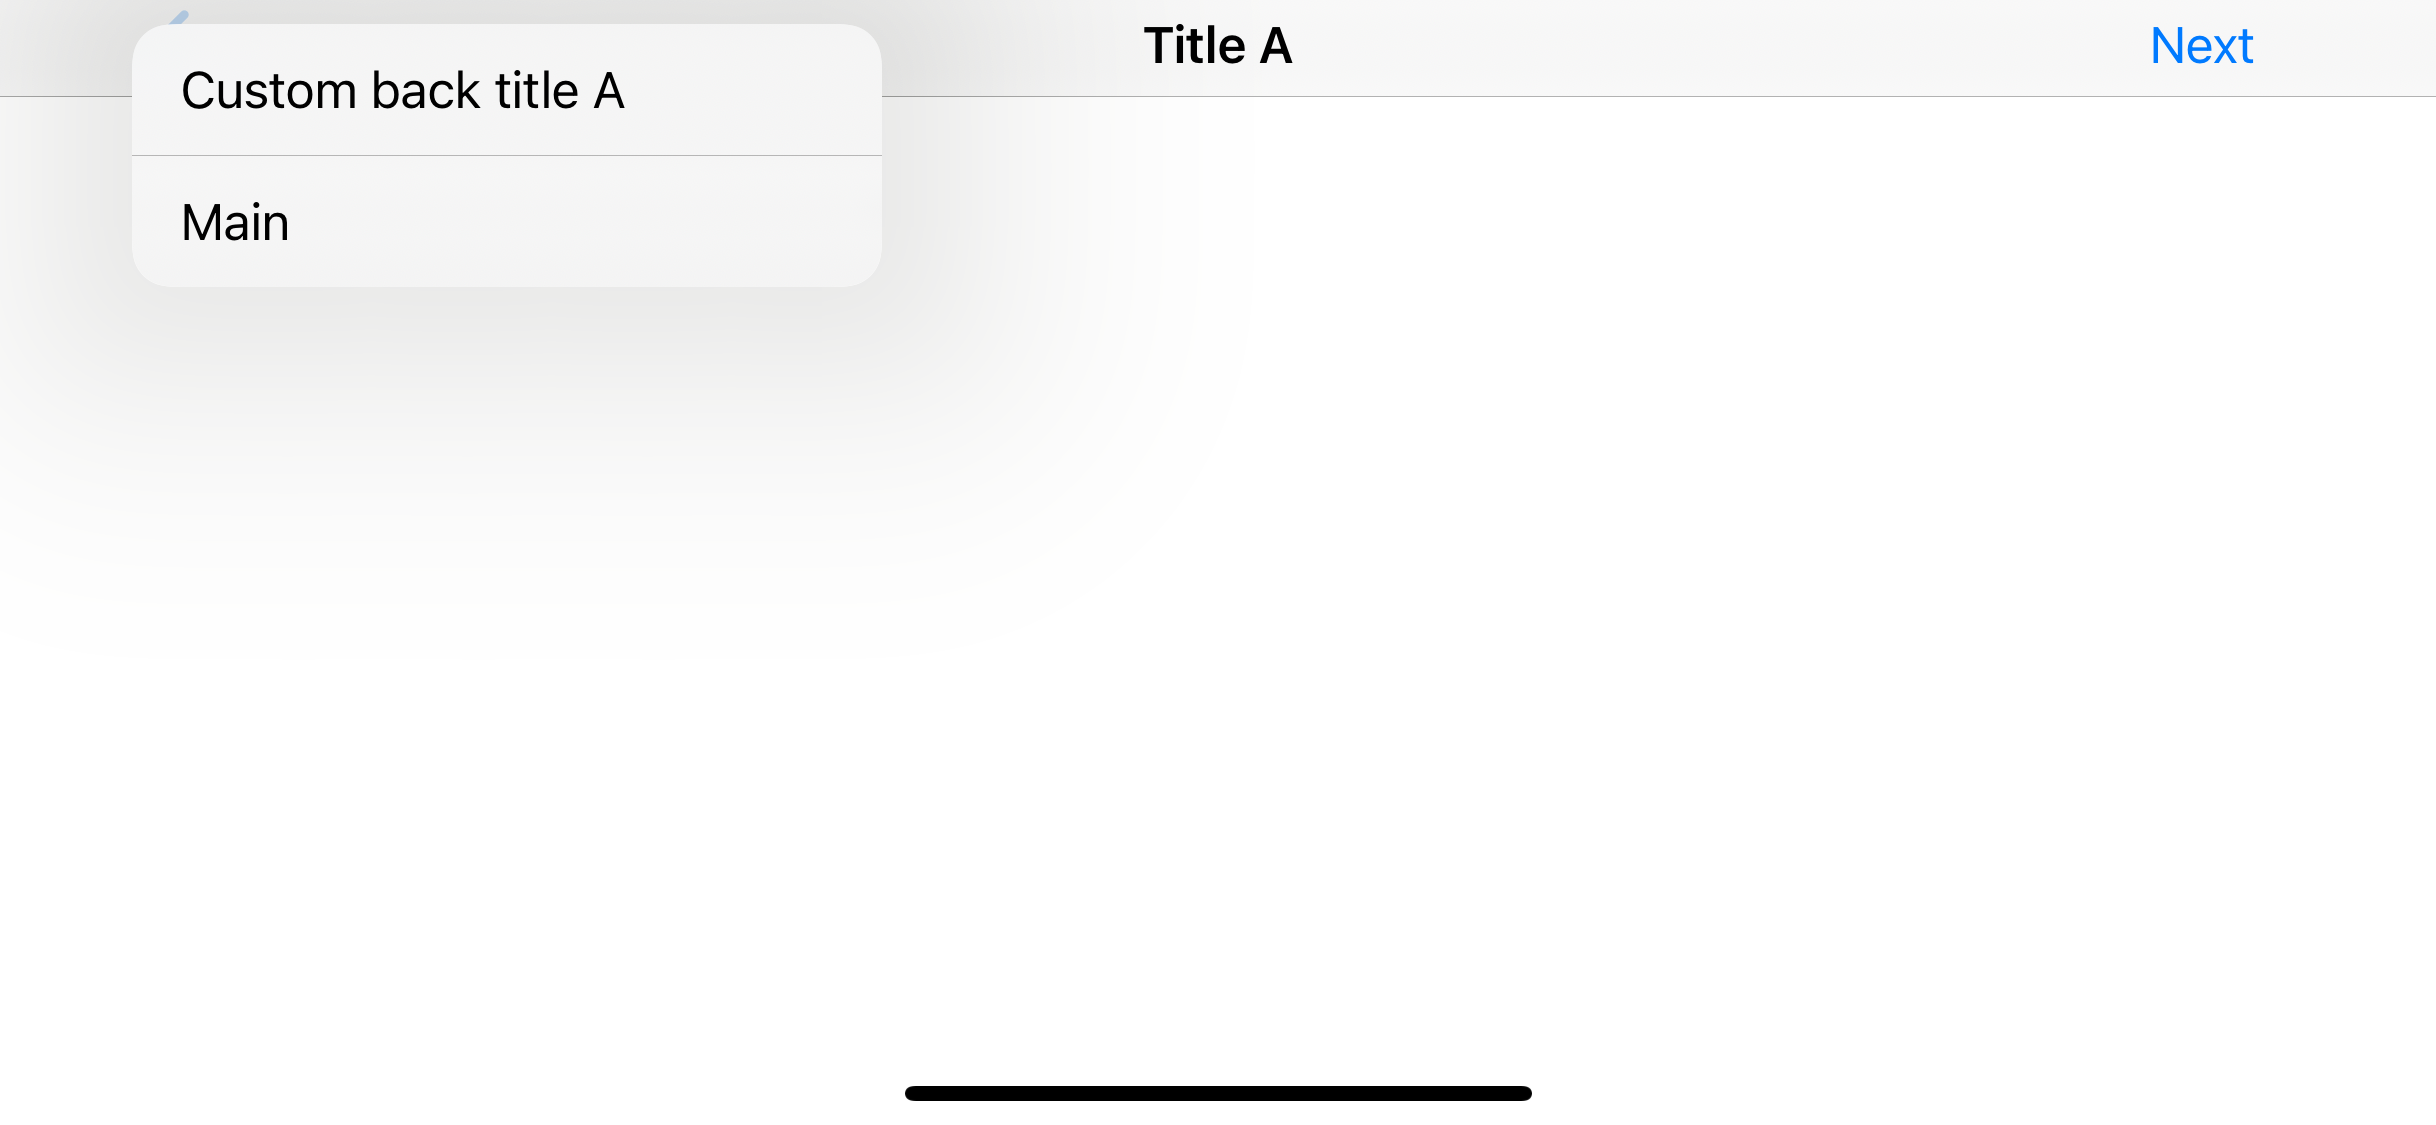
With iOS 14, if you're deep down in a navigation stack and want to head back to any level quickly, you can long-press the back button to bring up the history stack.
At first glance, this looks like a nice feature and nothing we need to do to adopt this. We get this behavior automatically when building our app against iOS 14 SDK.
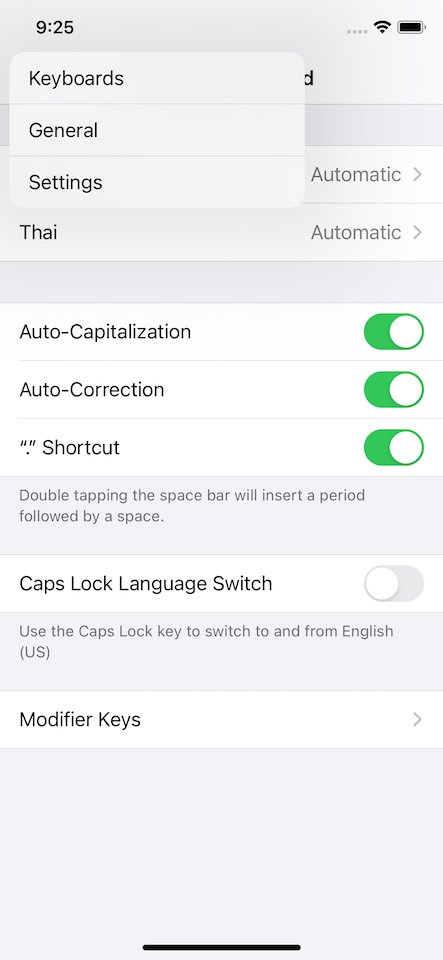
The problem is, it is quite a trend nowadays that designers would design an app without a back button title. The following are some example apps without a back button title.
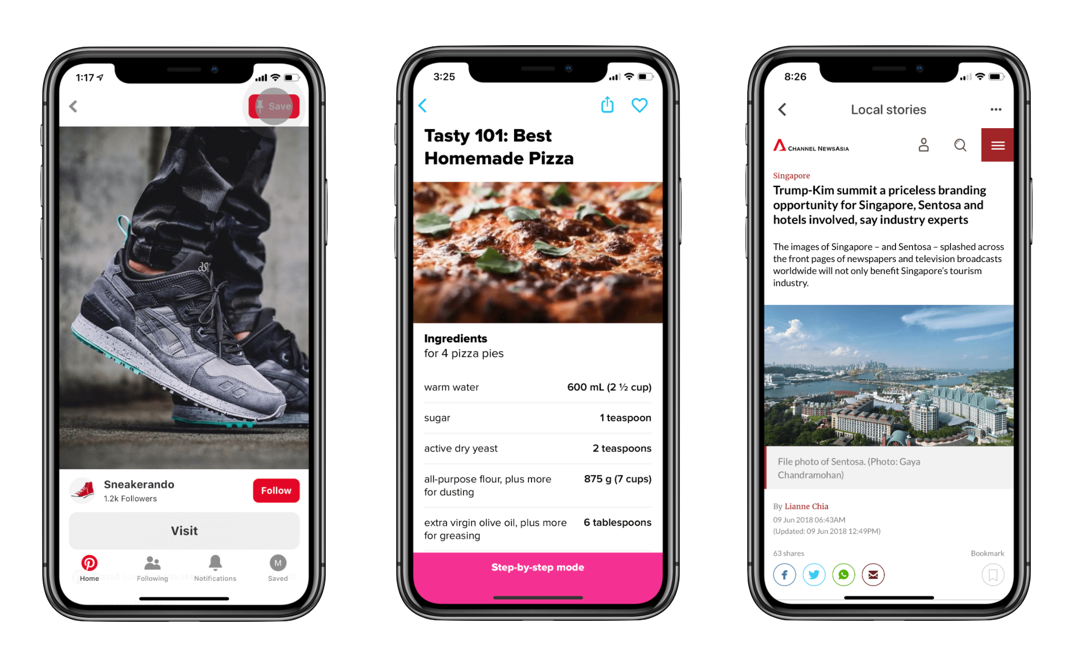
Without a back button title, history stack will look like this (I assume you hide back button title with this method).
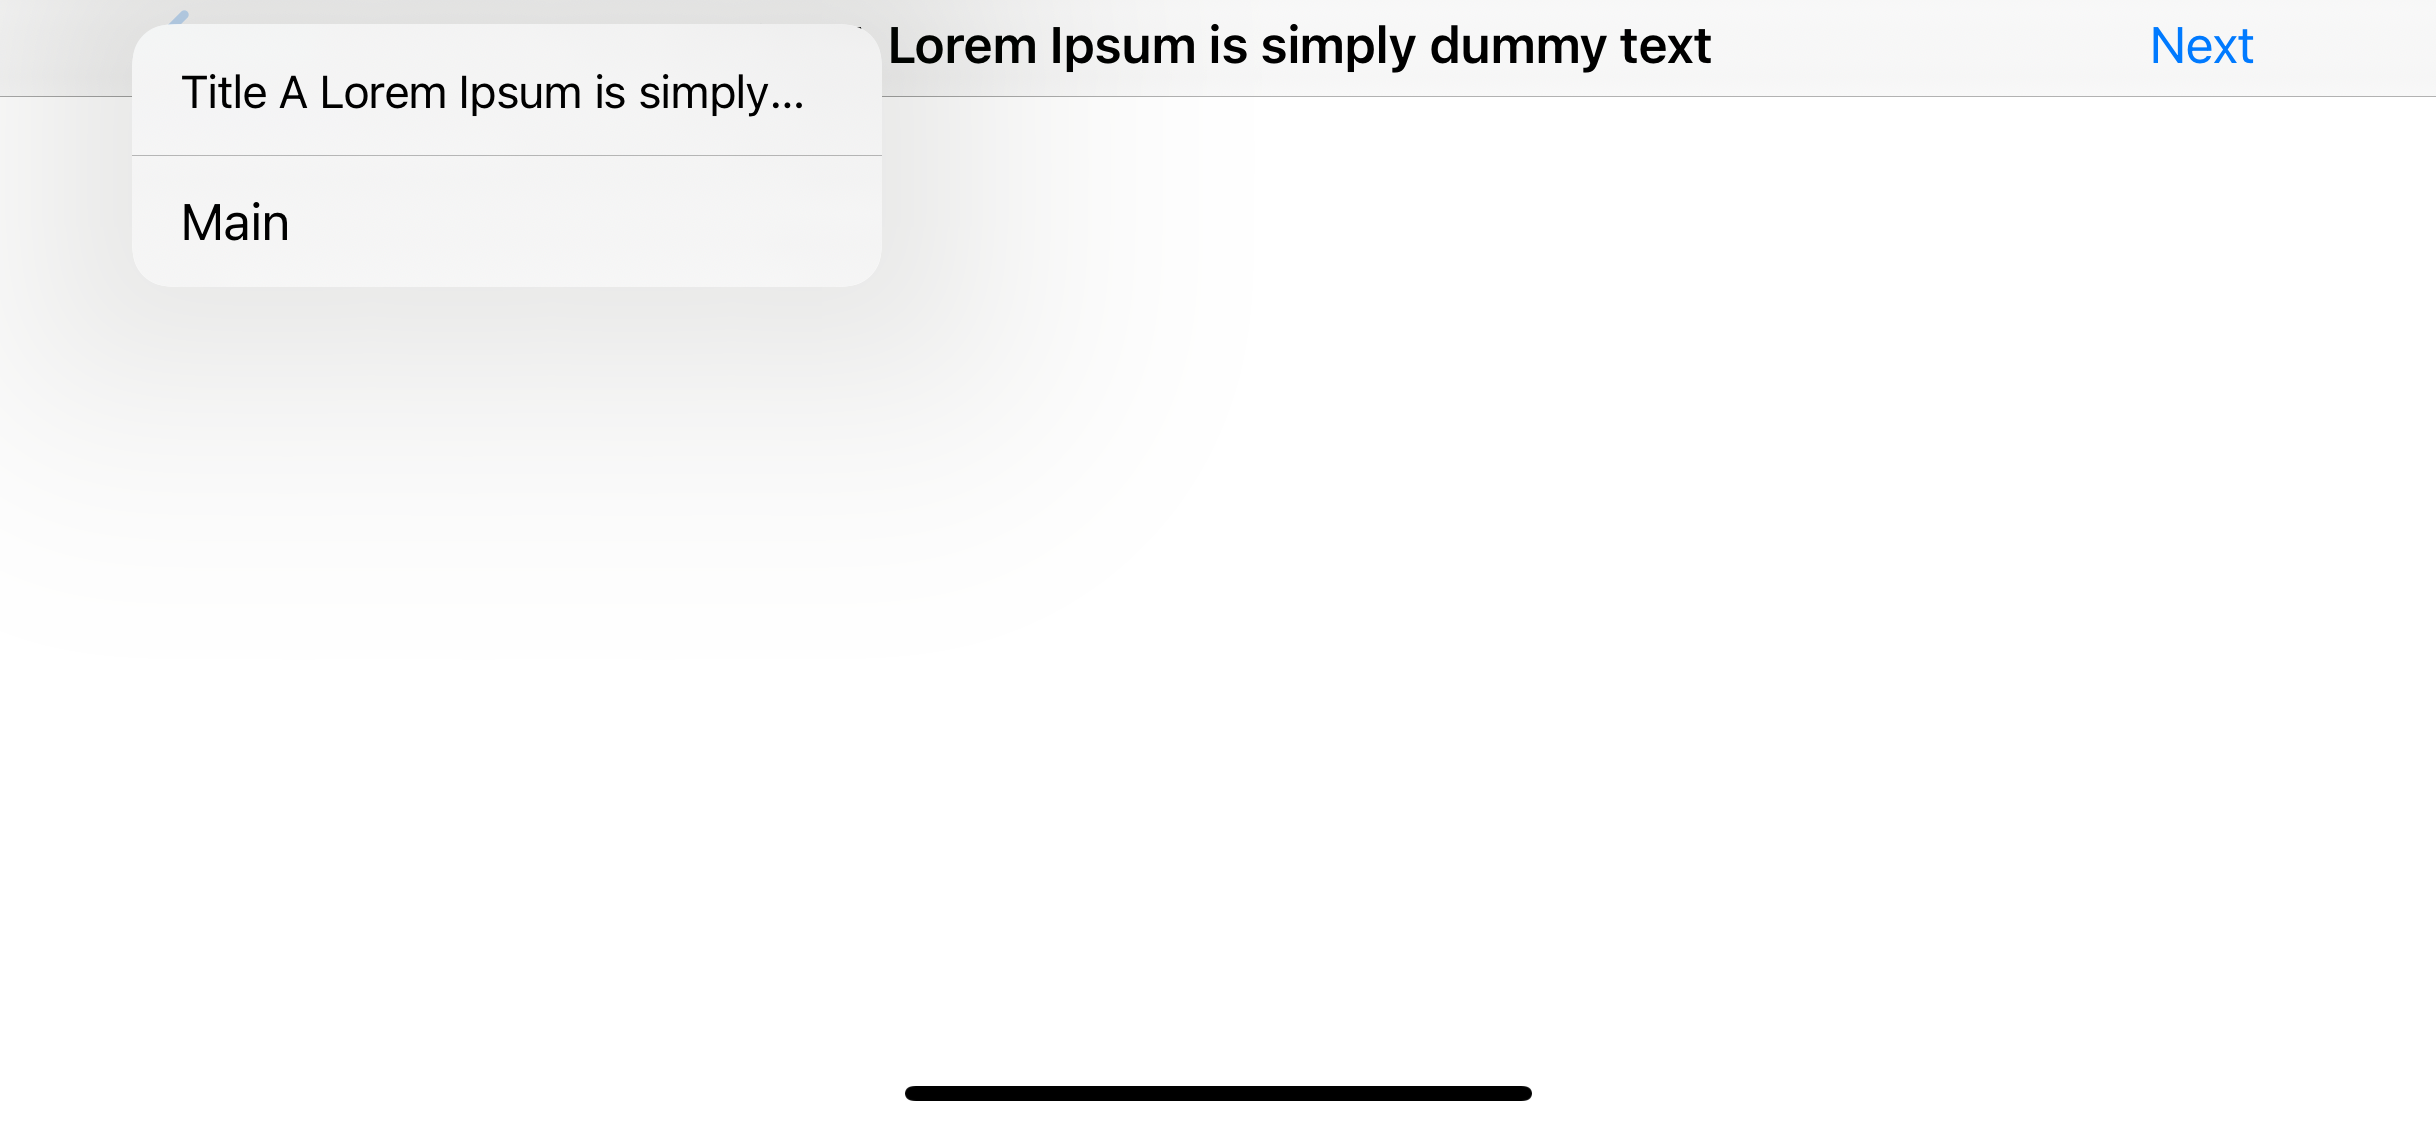
To solve this problem, we need to know which string is used as titles in a history stack. From my testing, a history stack getting the title from a navigation back button title, not the navigation title.
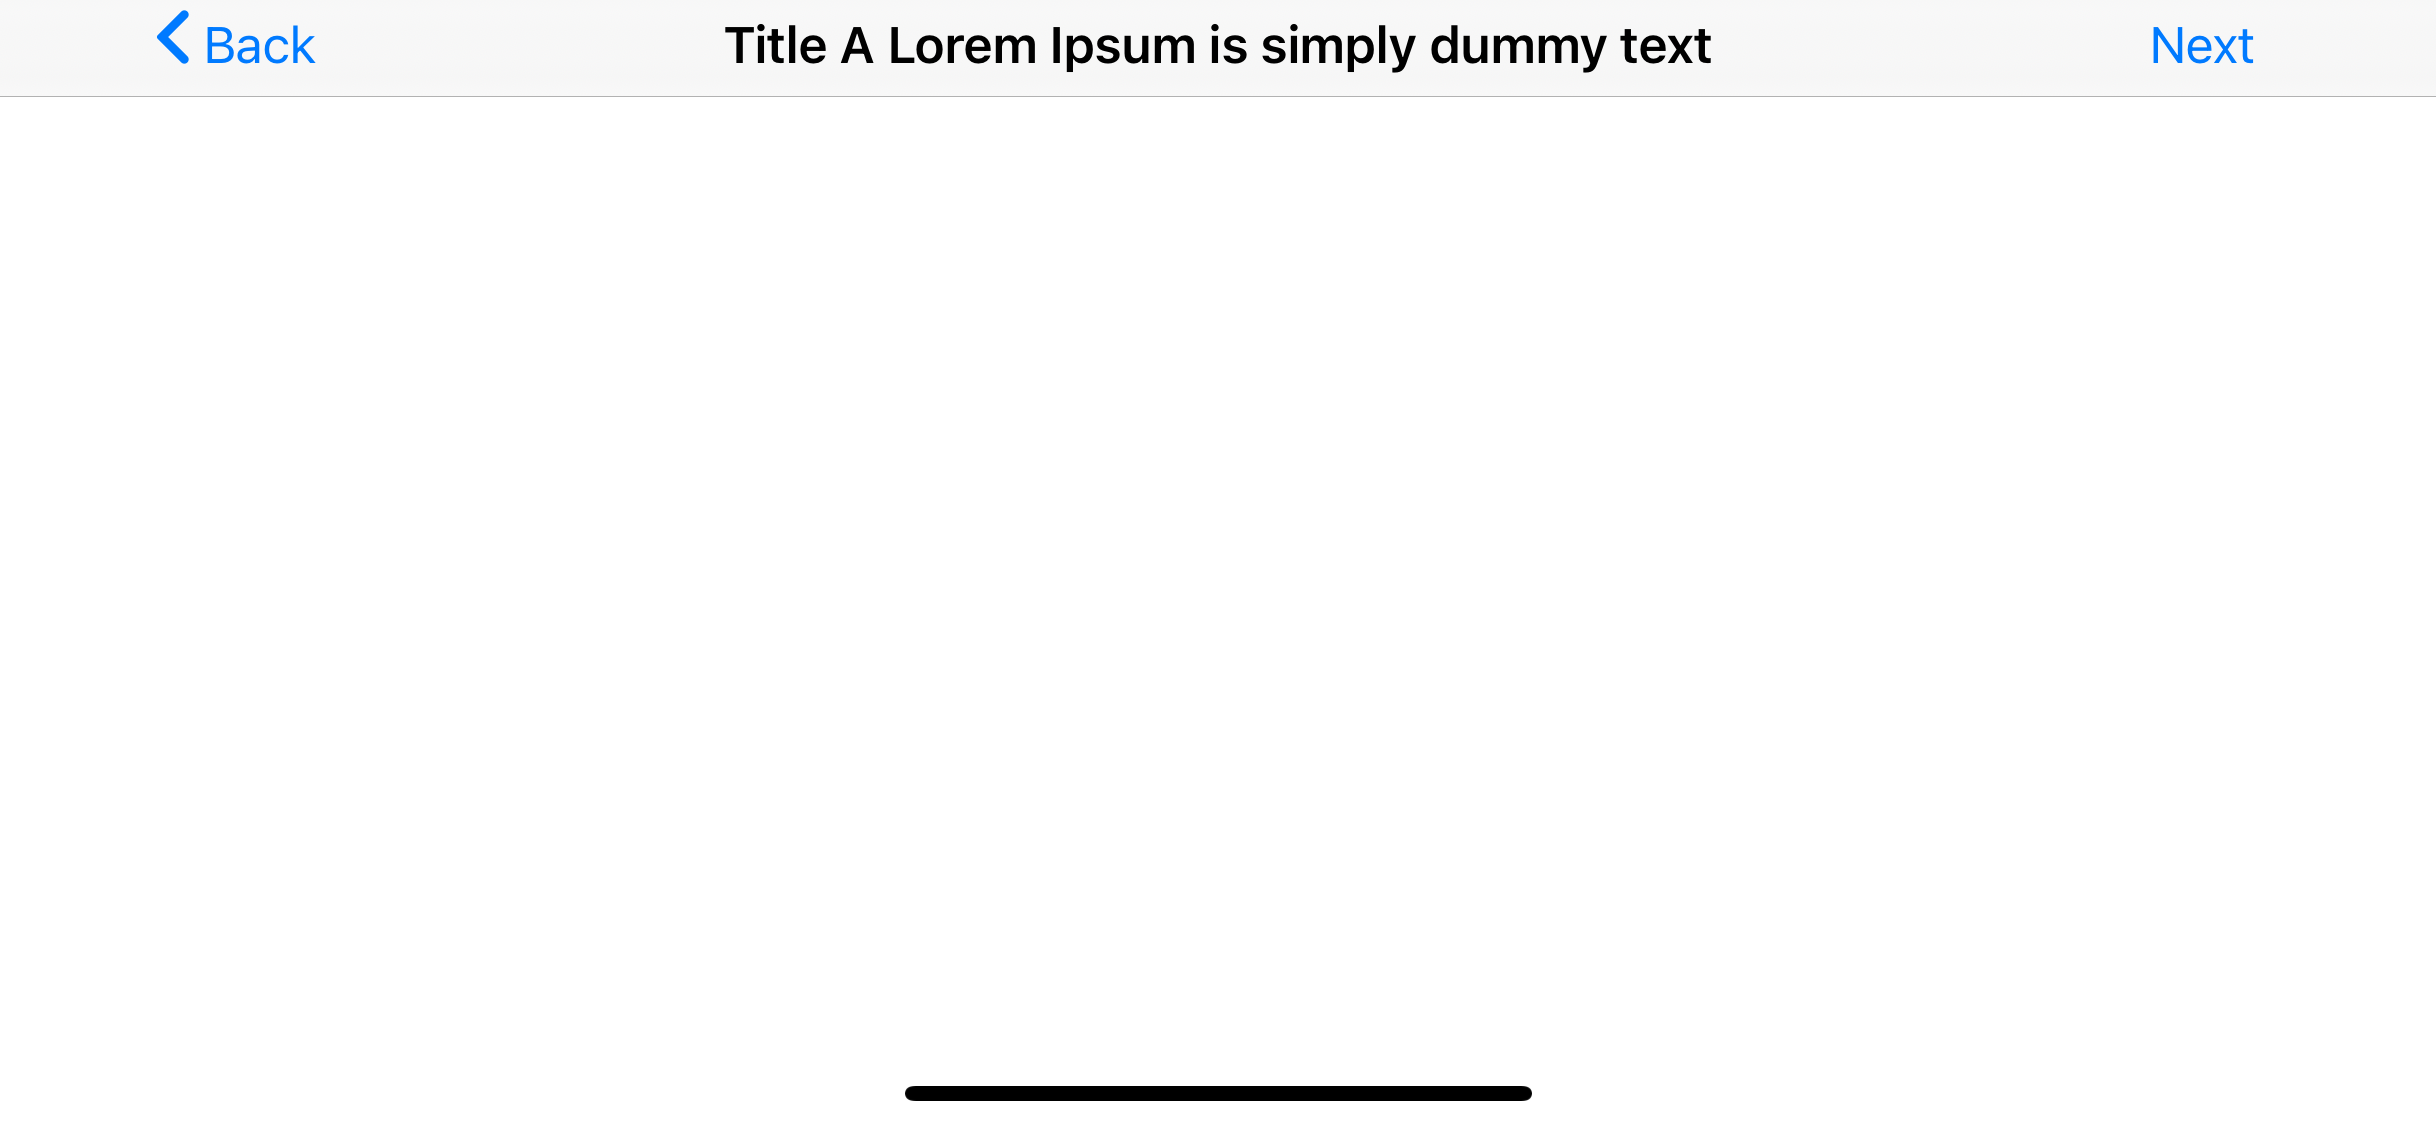
Let's test this out in different scenarios. In the following examples, I set up an AViewController where the right navigation item is pushing another AViewController to itself.
If we set only title, this title will also use as a back button title and also use in a history stack.
class AViewController: UIViewController {
    override func viewDidLoad() {
        title = "Title A"
    }
}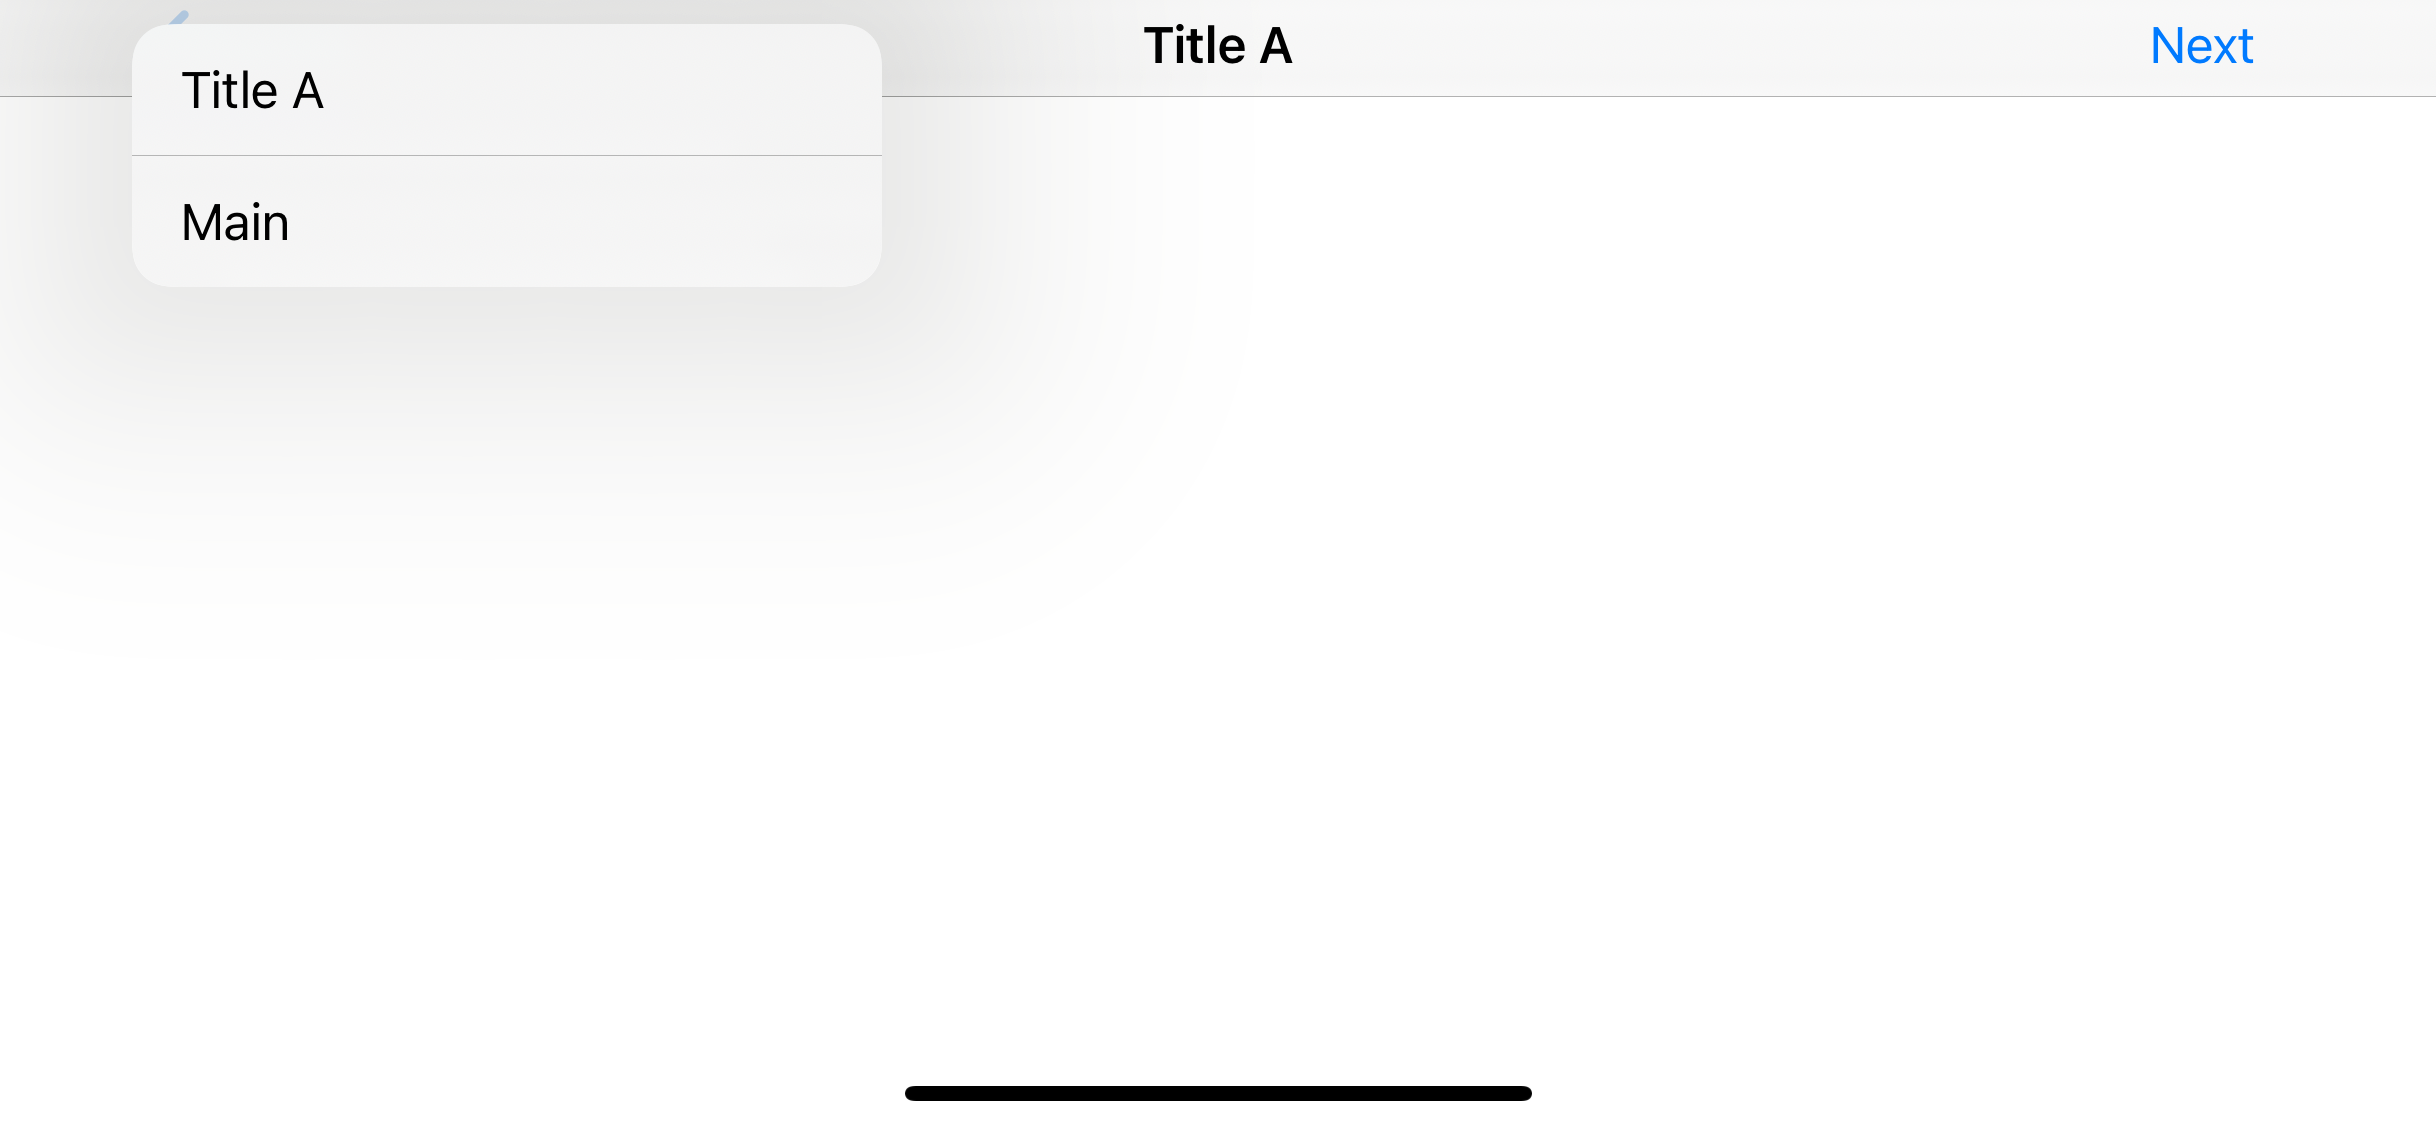
If your title is long enough, the back button title will be shortened to just "Back" for saving space, but this won't affect a title in a history stack.
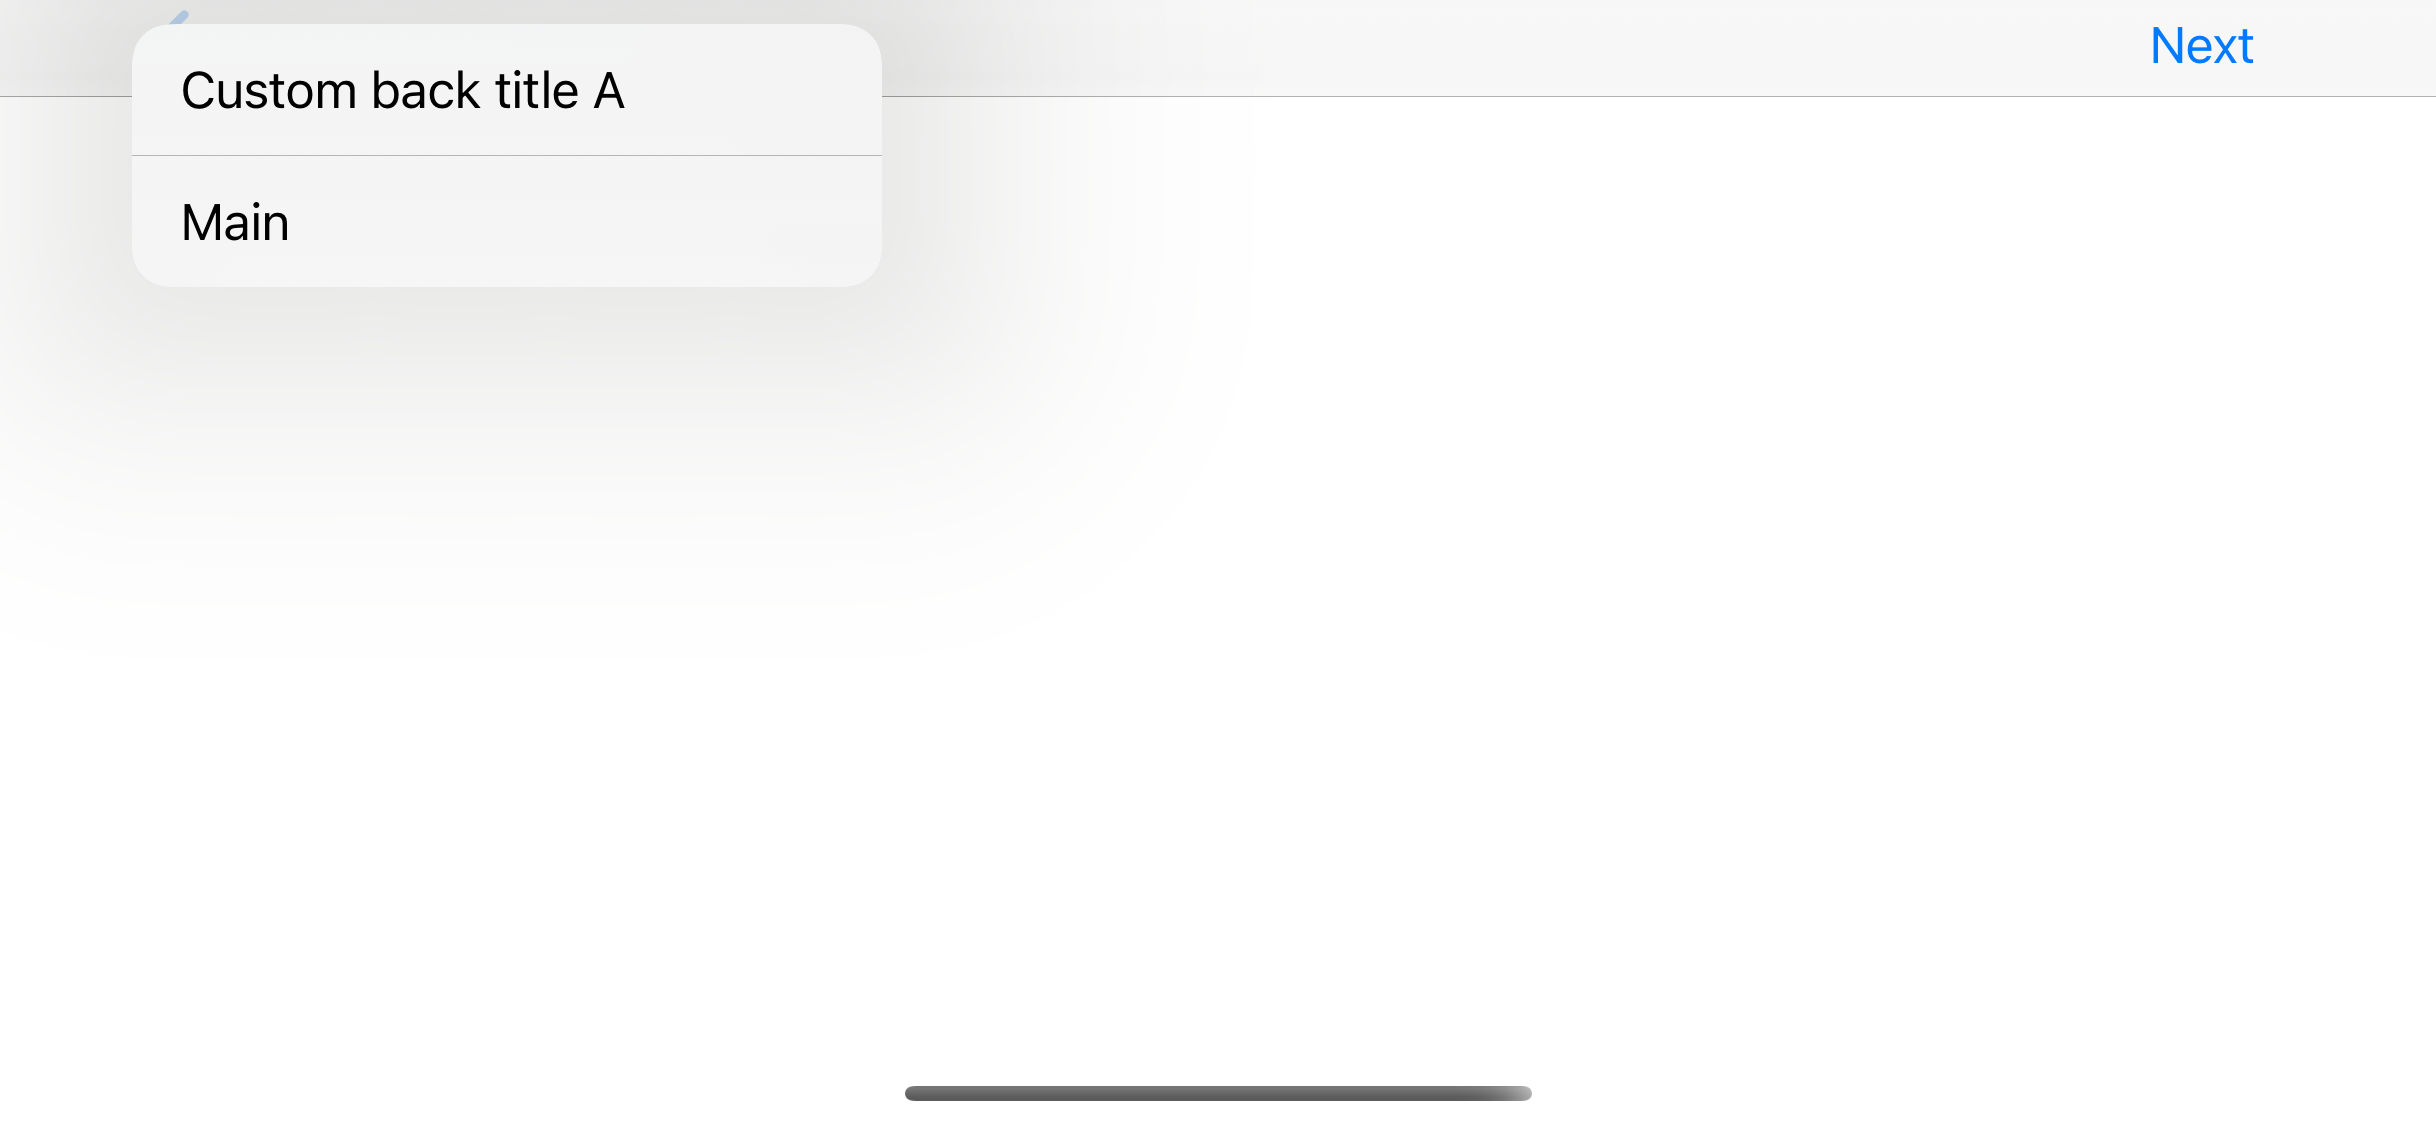
As mentioned before, a back button title string will be used in a history stack. So, the text in backButtonTitle will be used as a title in a history stack if set.
class AViewController: UIViewController {
    override func viewDidLoad() {
        title = "Title A"
        navigationItem.backButtonTitle = "Custom back title A"
    }
}

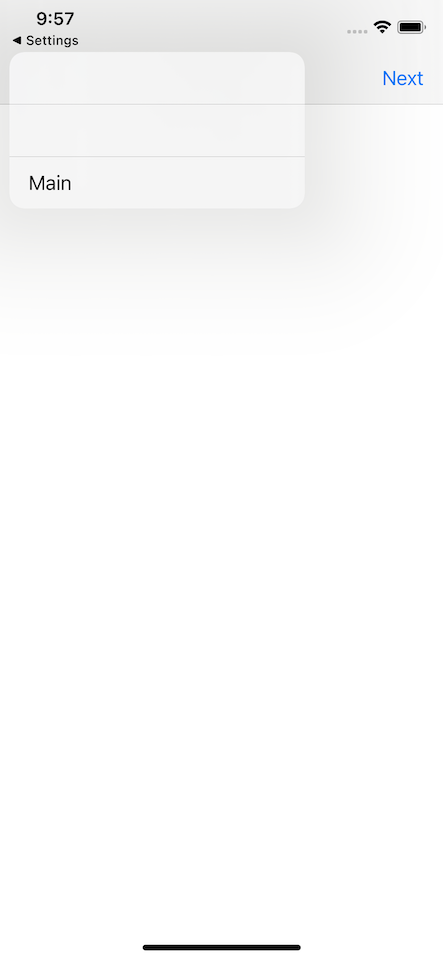
Since history stack depends on the back button title, set empty title won't affect a history stack. You can design an app with or without a title since this won't affect a history stack.
class AViewController: UIViewController {
    override func viewDidLoad() {
        title = ""
        navigationItem.backButtonTitle = "Custom back title A"
    }
}
This is the most interesting scenario of all since an empty back button title is quite popular among designers.
class AViewController: UIViewController {
    override func viewDidLoad() {
        title = "Title A"
        navigationItem.backButtonTitle = ""
    }
}
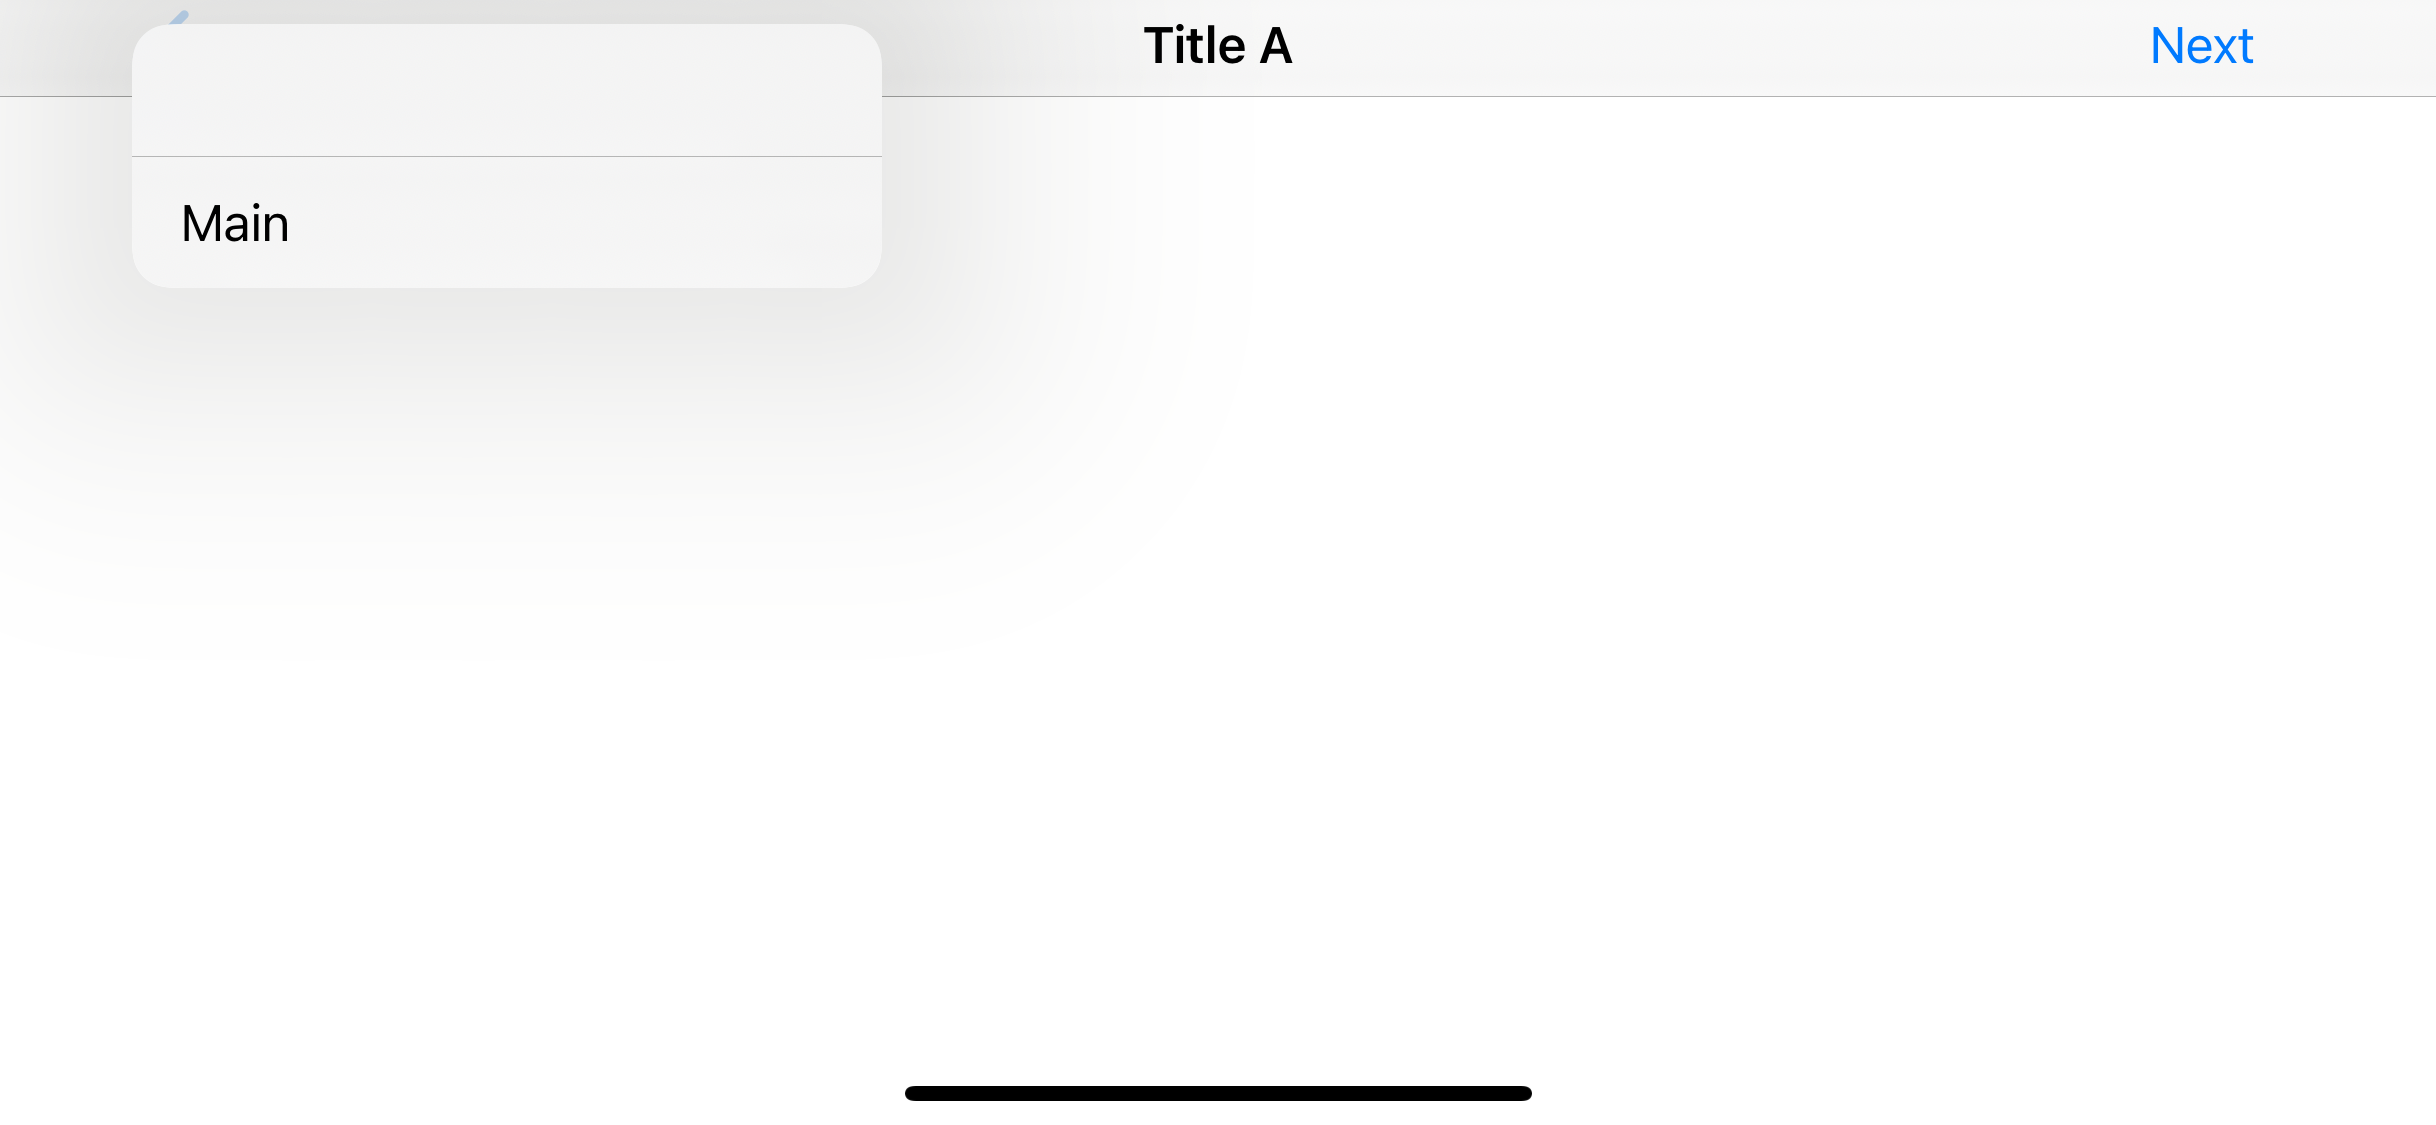
As you can see, this is the most harmful design for iOS 14. Does this mean we have to tell our designers to put back a button title from now on? Luckily, the answer is no. We can work around this problem.
We know that a back button title must be there for history stack to pick up a title. So, we have to set backButtonTitle a value you want to show in history and then try to hide it in UI.
The first idea that comes up is setting negative x offset like what we sometimes do with a CSS styling. You can hide a back button title with this method, but you will suffer from transition animation. You will see a title slide beyond the back button indicator.
UIBarButtonItem.appearance().setBackButtonTitlePositionAdjustment(UIOffset(horizontal:-500, vertical: 0), for: .compact)
UIBarButtonItem.appearance().setBackButtonTitlePositionAdjustment(UIOffset(horizontal:-500, vertical: 0), for: .default)
This solution is quite straight forward. We set a back button title color to transparent. This method uses some knowledge from UINavigationBar changes in iOS13, you might want to check it out.
let appearance = UINavigationBarAppearance()
appearance.configureWithDefaultBackground()

appearance.backButtonAppearance.normal.titleTextAttributes = [.foregroundColor: UIColor.clear]

UINavigationBar.appearance().standardAppearance = appearance
UINavigationBar.appearance().compactAppearance = appearance
This looks like a subtle change, but it requires some extra work on both the design and implementation phases. You can continue to design an app without a back button title, but make sure you provide a name for each view for a history stack.

Once in a while, every developer suffers from a long Xcode build time. This results in lowered productivity and a slowdown of the whole team’s development process. Enhancing build time is crucial — it has a direct impact on time to market of new features.
In this Part 1, we’ll learn how to profile the Xcode build and get its metrics. In the next part, I’ll go through techniques to resolve bottlenecks and speed up the build. It should also be mentioned that we’ll be using a Kickstarter iOS project, that can be found on Github.
Let’s get started!
First, we need to define what are we trying to measure and optimize. There are two options:
In most of cases, clean build time improvements should also speed up the incremental build. The best option would be to generate metrics for both build types and keep track of them. We’ll be measuring builds created with the Debug configuration, only because it’s the most commonly used and has a higher impact on development.
The most efficient way of improving the build time is by taking a data-driven approach, introducing and verifying changes based on the build metrics. Let’s dive into that and take a look at the tools we can use to get insights into a project’s build time.
We can get the build time easily via Xcode. Xcode keeps track of all your builds by default and you can examine the times and logs from the Report Navigator.

There is an option to display similar information in the Xcode activity viewer. You can enable it from the command line:
defaults write com.apple.dt.Xcode ShowBuildOperationDuration YES
The builds duration appears after a build, alongside the “Succeeded” message.

These are just two basic options that should give you a rough idea about Clean and Incremental build times.
The Xcode Build Timing Summary is your first friend in getting build time insights and finding bottlenecks. You can run one via Product->Perform Action->Build With Timing Summary, which will give you a great breakdown of times spent on different tasks:
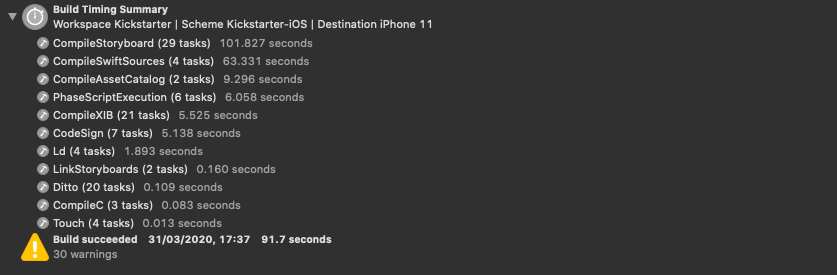
This is a nice starting point to find out the most time-consuming tasks in your build process.
As you can see from the screenshot above, CompileStoryboard, CompileAssetCatalog, CompileSwiftSources, and the PhaseScriptExecution phases took most of the build time. Xcode managed to run some of the tasks in parallel, which is why the build was finished much faster than the sum of all the tasks.
We can get build timing summary for the clean build using xcodebuild with the -buildWithTimingSummary option:
Now, let’s get similar metrics for the incremental build. It should be mentioned that incremental build time fully depends on the files being changed in your project. To get consistent results you can change a single file and rebuilt the project. Unlike Buck or Bazel, Xcode uses timestamps to detect what has changed and what needs to be rebuilt. So, we can update a timestamp using touch:
If Swift compile time is the bottleneck, we can get more information by setting Other Swift Flags from the Xcode build settings. With these flags enabled Xcode will generate a warning for any function or expression that took longer than 100ms to type-check:
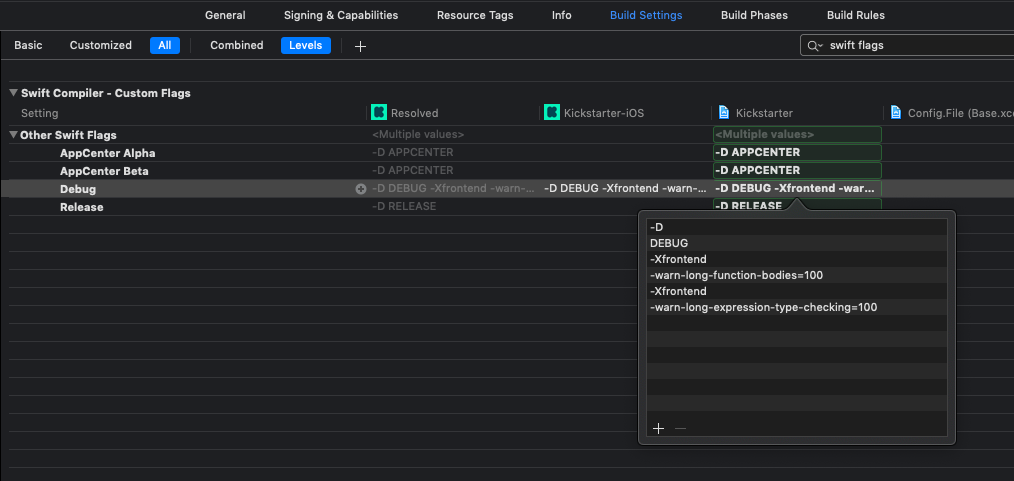
Now you know that the code Swift compiler has problems, you can try to come up with some improvements.
The Swift compiler has a variety of built-in diagnostic options you can use to profile the build.
Let’s use -debug-time-compilation flag to get the top slowest files to compile:
As you can see, it took 25s to compile SettingsNewslettersCellViewModel.swift. From the build log, we can get more information about the file compilation time:
Now it’s clear that Type checking and Semantic analysis is the most time-consuming job. Let’s move forward and list the slowest function bodies and expressions in the Type Checking stage:
Just like that, we’ve profiled our build and discovered that we have quite a few bottlenecks in the Type Checking stage. As the next step you can have a look at the functions and expressions listed above and try to optimize type inference.
It’s handy to measure the targets build times separately and show them on a chart. This can help in understanding which targets are built or can be built in parallel. We can use the xcode-build-times-rendering tool for this. Let’s install one as a RubyGem:
gem install xcode-build-times
After installation is complete, run the following command that injects timestamp logging in Run Script Build Phase of your targets:
xcode-build-times install
Then build the project and generate a report:
xcode-build-times generate
You should get a nice build-time Gantt chart, that shows the build times of all your targets:
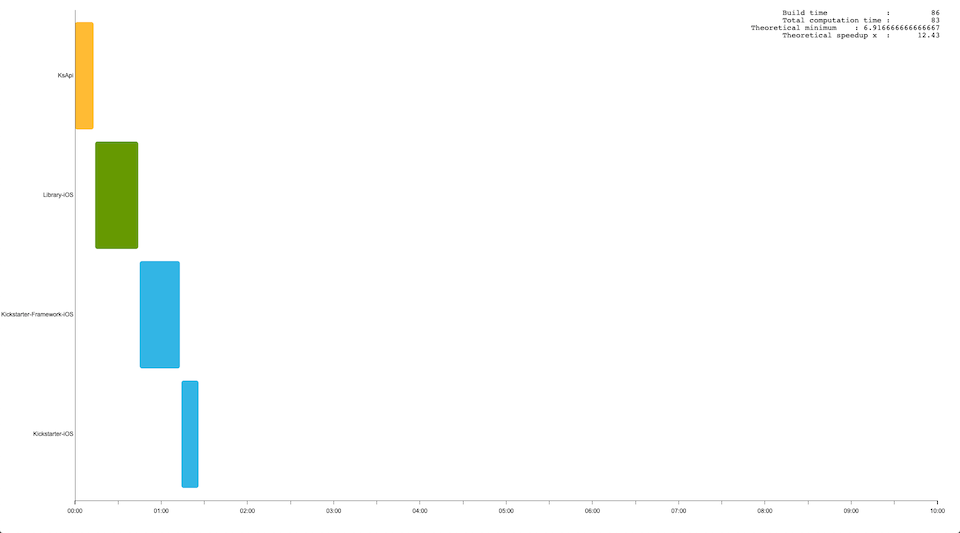
It would be great to aggregate the different metrics mentioned above. XCLogParser is a great tool that can help you with this. It’s a log parser for Xcode-generated xcactivitylog and gives many insights into build times for every module and file in your project, warnings, errors and unit tests results. You can install it by cloning the repository and run it via the command line:
git clone https://github.com/spotify/XCLogParser
rake build
xclogparser parse --project Kickstarter --reporter html
This is the report created for the Kickstarter iOS project:
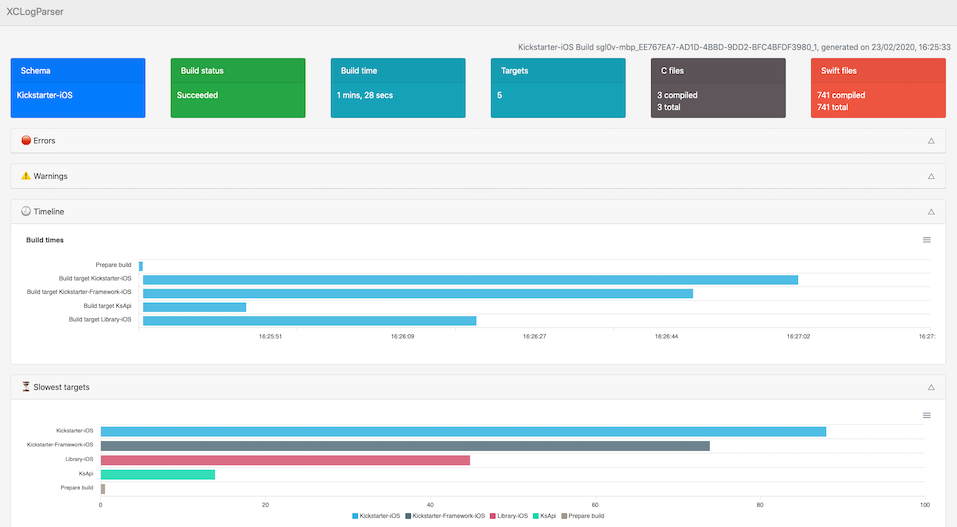
It should be pointed out that build time metrics are dependent on hardware and its utilization. You can use your machine for experiments. The better option would be automating the process as much as you can and using a dedicated CI machine to get metrics daily. Eventually, you can keep track of them on a dashboard and notify about the build time degradation via Slack.
Build time speedup is crucial for developers’ productivity and the product’s time to market. Today we’ve learned how to measure the Xcode build time and get some metrics to analyze.
How do you measure your build time? Are you using any of the techniques mentioned in this article? Feel free to leave a comment.
Thanks for reading!
Xcode Build Time Optimization (Part 1) was originally published in Better Programming on Medium, where people are continuing the conversation by highlighting and responding to this story.

Let’s talk about how to set up continuous integration and continuous delivery (CI/CD) with GitHub Actions. But wait a minute — what does CI/CD mean?
When different developers work together in an application, if the merge of code occurs at the same time, numerous problems can occur: conflicts between different developers’ code, errors, etc. This all makes the process slow. This is where CI/CD comes in.
Continuous integration (CI) allows different developers to upload and merge code changes in the same repository branch on a frequent basis. Once the code has been uploaded, it’s validated automatically by means of unit and integration tests (both the uploaded code and the rest of the components of the application). In case of an error, this can be corrected more simply.
In continuous delivery (CD), the new code that’s been introduced and that’s passed the CI process is automatically published in a production environment (this implementation may require manual approval). What’s intended is that the repository code is always in a state that allows its implementation in a production environment.
In continuous deployment (CD), all changes in the code that have gone through the previous two stages are automatically implemented in production.
There are numerous tools to configure and perform the entire CI/CD process:
GitHub Actions is a new tool to perform the CI/CD process, introduced in October 2018, launched in beta in August 2019, and finally distributed in November 2019. GitHub Actions is also paid, although it has a free version with some limitations.
To show how to use GitHub Actions in the CI/CD process on iOS, I’ll use my own project (based on a Sean Allen course).
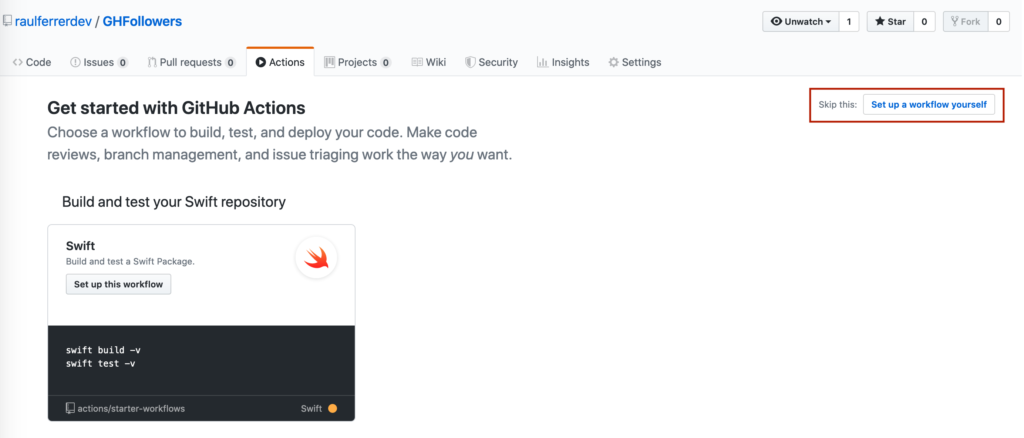
First, we enter our GitHub project and access the Actions tab:

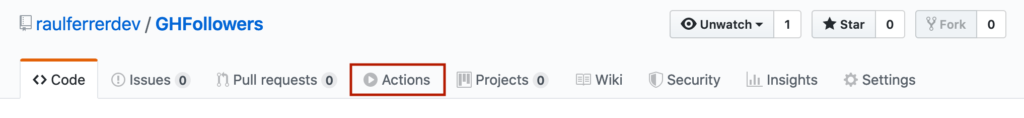
We access a screen that allows us to choose between a predefined workflow or establish our own. In our case, we’ll choose to establish our own.
We see how there’s a workflow in a file called main.yml, which is in .github/workflows/. We can have different files with different workflows.
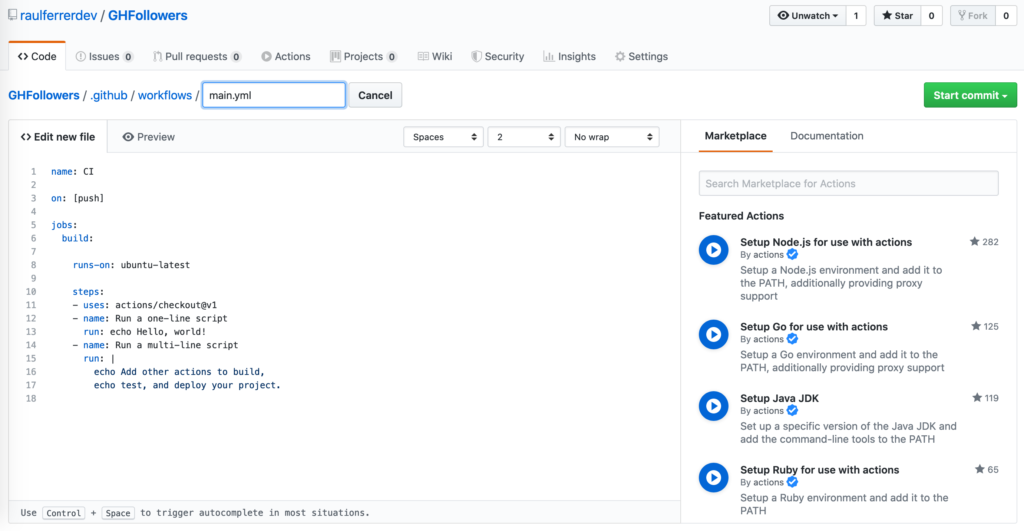
Now we’ll change the content of the file so on the one hand it executes the application and, on the other, it executes the programmed tests.
It’s a label for our workflow.
GitHub executes workflows that are defined with the on key — in our case, any push event. We can also define a specific branch. For example, push events in the devel branch:
on:
  push:
    branches:
    - devel
Each workflow is made up of one or more jobs. In our case, there’s only one.
This parameter contains the type of virtual machine in which the code will be executed. In this case, we’ll use macos-latest (to see the different types of virtual machines available).
A strategy creates a matrix of environments in which to execute the work. Each matrix allows us to establish a set of different configurations of the virtual environment. In our case, we set the iOS simulator, with the operating system 13.2.2 and an iPhone 11 Pro Max device:
strategy:
        matrix:
          destination: ['platform=iOS Simulator,OS=13.2.2,name=iPhone 11 Pro Max']
A step is a sequence of tasks. In the example we’re seeing, the first step is to check the repository so the workflow can access it. In this case, this means the master branch.
- name: Checkout
  uses: actions/checkout@master
In the second step, the application is built in the environment defined above (destination):
- name: Build
    run: |
       xcodebuild clean build -project GHFollowers.xcodeproj -scheme GHFollowers -destination "${destination}" CODE_SIGN_IDENTITY="" CODE_SIGNING_REQUIRED=NO ONLY_ACTIVE_ARCH=NO
    env:
      destination: ${{ matrix.destination }}
Finally, in the last step, the tests created in the application are executed:
- name: Test
  run: |
          xcodebuild clean test -project GHFollowers.xcodeproj -scheme GHFollowersTests -destination "${destination}" CODE_SIGN_IDENTITY="" CODE_SIGNING_REQUIRED=NO ONLY_ACTIVE_ARCH=NO
  env:
         destination: ${{ matrix.destination }}
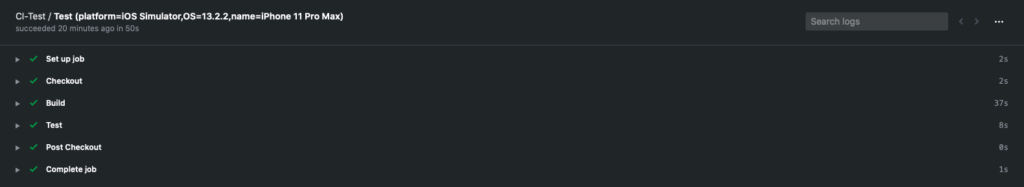
When we upload code to the repository, this workflow will run. If we access the Actions tab of the repository again, we can see a list of the times the workflow has been executed. In this case, if no error has occurred, we obtain the following:
We can prove what happens when one of the tests fails. By changing one of the tests so that it is not met, you get:
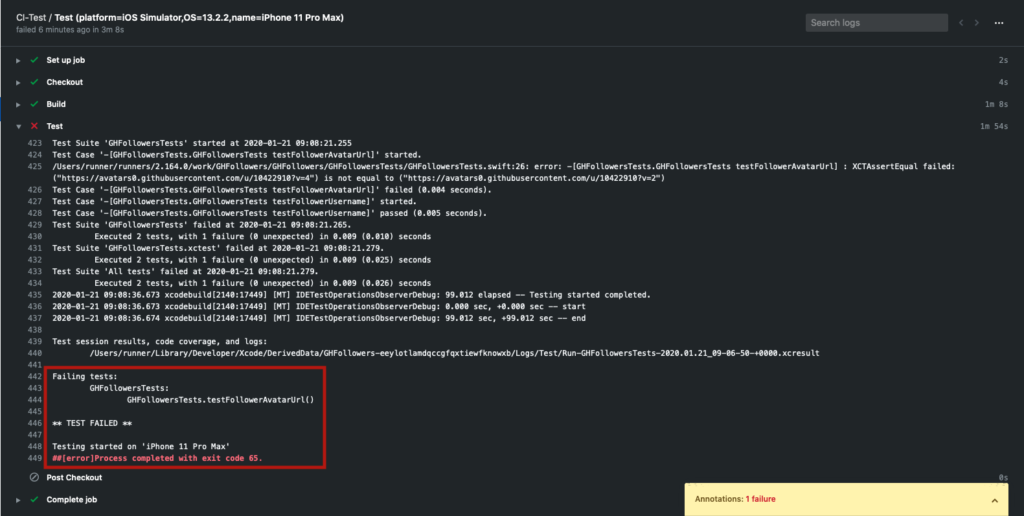
Here we can see what test has failed.
GitHub Actions is a new player in the group of CI/CD tools available. Its appearance is recent, so it’s necessary to see how it evolves against tools such as TravisCI, Bitrise, or Jenkins.
How to Set Up CI/CD With GitHub Actions for iOS was originally published in Better Programming on Medium, where people are continuing the conversation by highlighting and responding to this story.